There are no official statistics on the number of strikes and worker protests in China. CLB’s Strike Map is currently the only publicly accessible database that contains detailed information (in English and Chinese) on more than 16,000 workers’ collective actions in China dating back to 2011.*
The map is updated regularly by our staff in Hong Kong. To get the latest updates, please follow @CLBStrikeMap (English) and @bagongditu (Chinese) on Twitter. Our other media platforms regularly use Strike Map data to pinpoint the latest trends in worker activism in China, including our main CLB Twitter, Facebook, Instagram, Chinese-language podcast, and monthly email newsletter.
The Strike Map is designed to help journalists, researchers, trade unionists, and others better understand the frequency and distribution of strikes, as well as the characteristics of worker protests in China. To this end, CLB publishes regular news articles and features analysing recent Strike Map incidents and trends. We also produce occasional in-depth research reports that provide a more comprehensive analysis of the data over a longer period of time and across a range of industries and professions.
Data Sources and Update Frequency
Information in the Strike Map primarily comes from domestic social media platforms, including Weibo, WeChat, Douyin, Kuaishou, and others. China Labour Bulletin searches for workers’ posts about protests and strikes on these platforms. We compile the data in the map each week, and at the end of each month, we conduct additional verification of the information to ensure its accuracy.
Criteria for adding an incident to the Strike Map includes s that an incident clearly indicates the location, date or time period, workers’ demands, the industry, and the relevant company. Therefore, some collected events with incomplete data are excluded. Since we rely on information spontaneously provided by workers, the information on the Strike Map may not indicate the duration or outcome of events.
A Guide to Using the Map’s Interactive Features
For those wishing to do their own analysis or identify specific trends in worker protests, the various interactive features of the map are outlined below.
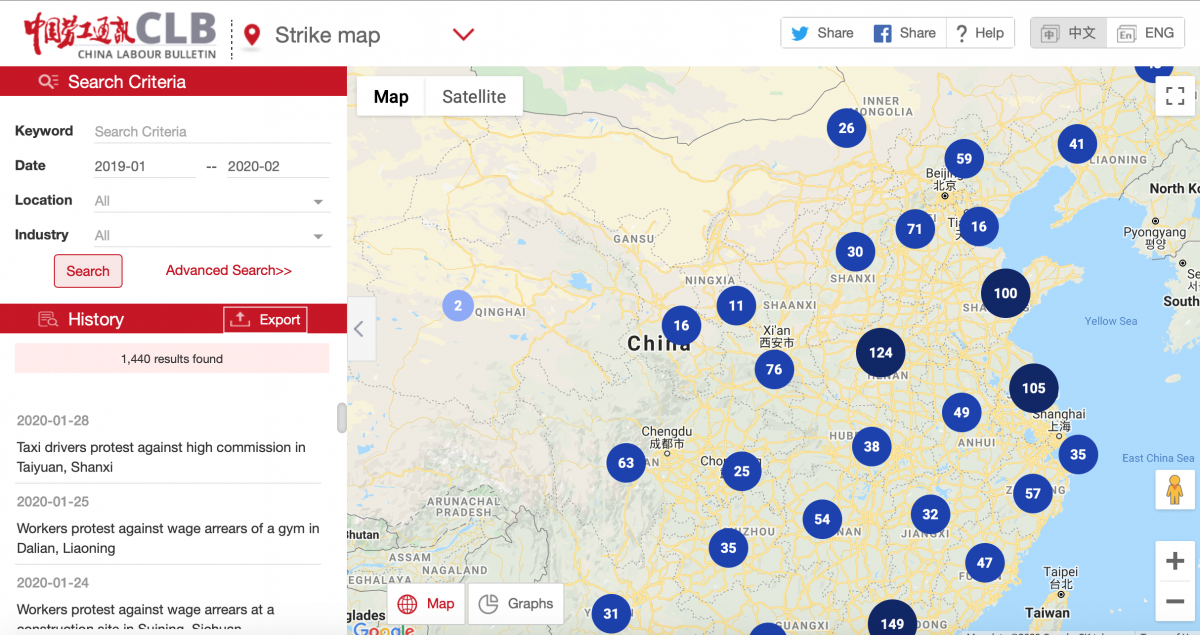
The default date range on the map is the last six months, but users can select any month ranges from January 2011 onwards. The results are displayed grouped by province on the map and listed chronologically in the left-hand sidebar (see screenshot below).
In addition to selecting the desired timeframe, users can select to view data from particular regions and/or industrial sectors. These parameters allow for selecting a single province or even an individual city, and then an industry or subsector. For example, a user could select the manufacturing sector in Guangzhou from August 2019 to February 2020. Zooming in on the map will reveal more details. Users can select various industrial sub-sectors, such as electronics under manufacturing, food delivery under transportation or sanitation workers in services.
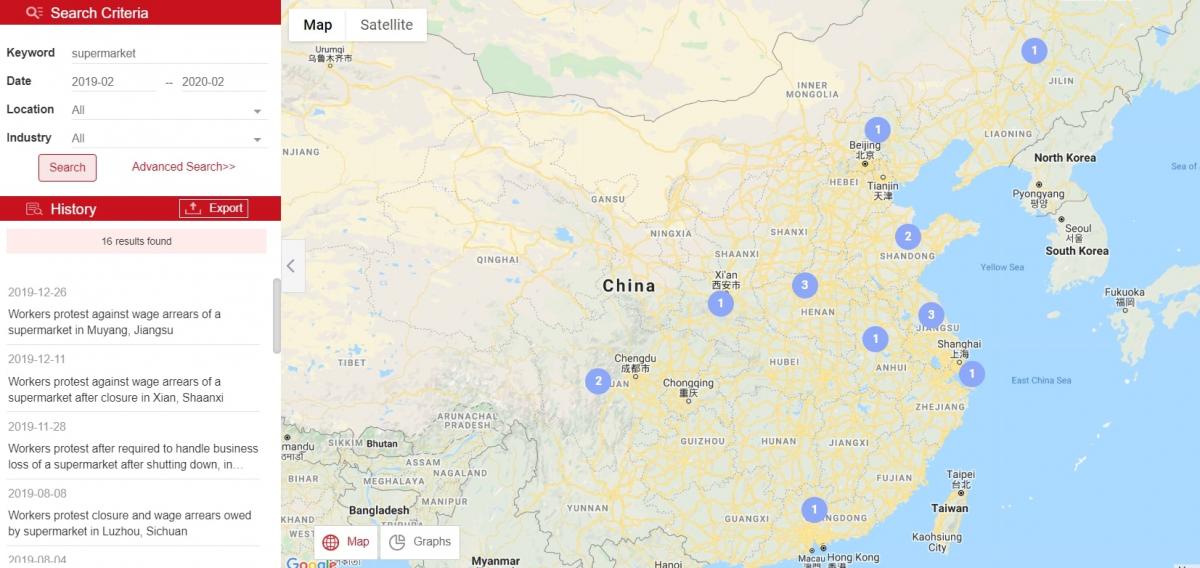
Another search method is by keyword, such as “supermarket,” to see all the protests by supermarket employees over the time period selected. These keyword results can be limited by time, geography, and sector as well.
For even more options and parameters, click Advanced Search. Here, users can select enterprise type (private enterprise, SOEs, etc.), employee demands (for example, payment of wages in arrears), type of collective action taken by the workers, and number of participants involved.
In many, but not all, cases users can examine the response of the employer and the local authorities to the workers’ protest actions, such as negotiations or police arrests. But be advised that most records on the responses are not comprehensive, because follow-up information is generally not available in the materials used to compile the map.
Users can conduct further analysis based on the map’s underlying data by exporting the selected data to an Excel file. Just click the button [Export data] at the top of the left-hand sidebar incidents list. It is possible to export all data by setting the date parameter from January 2011 to the present.
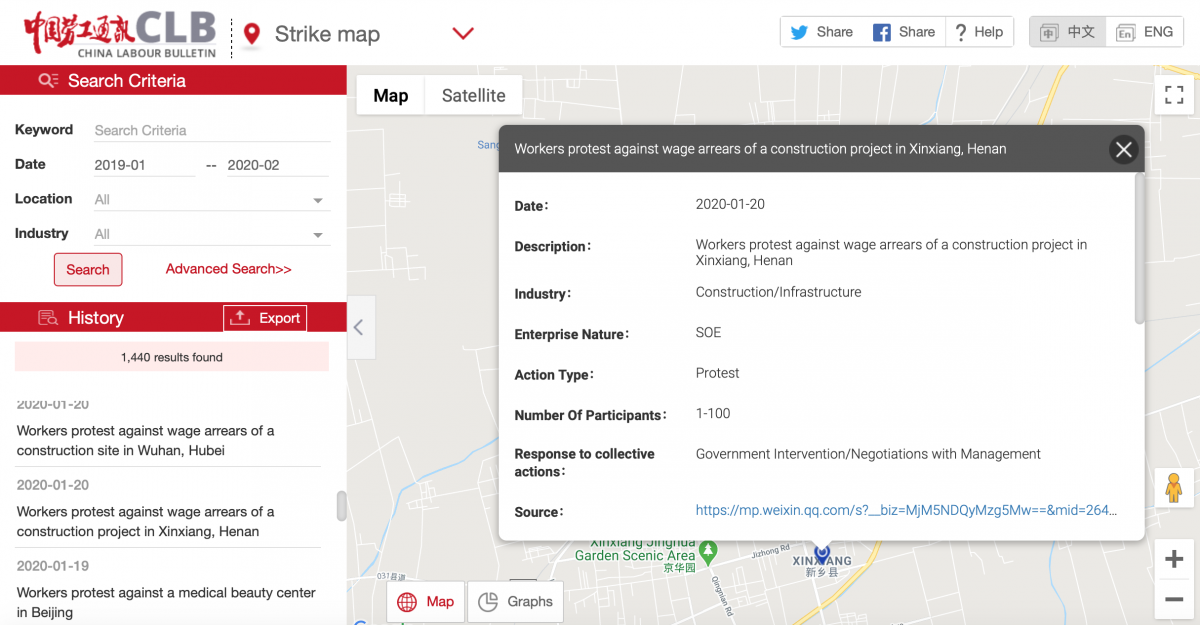
To get more details on specific incidents, click on the incident marked on the map or listed in the left-hand sidebar. Here is displayed a brief description of the event, plus links to and screenshots of the source material in Chinese. We cannot verify all the information contained in the original source. However, we make every effort to verify that the basic elements, such as time and location, are correct for every record. Normally, the precision of the locations displayed on the maps is limited to the extent of counties or prefecture-level cities (for cases located in urban regions). You may find more precise details in the text descriptions of many cases.
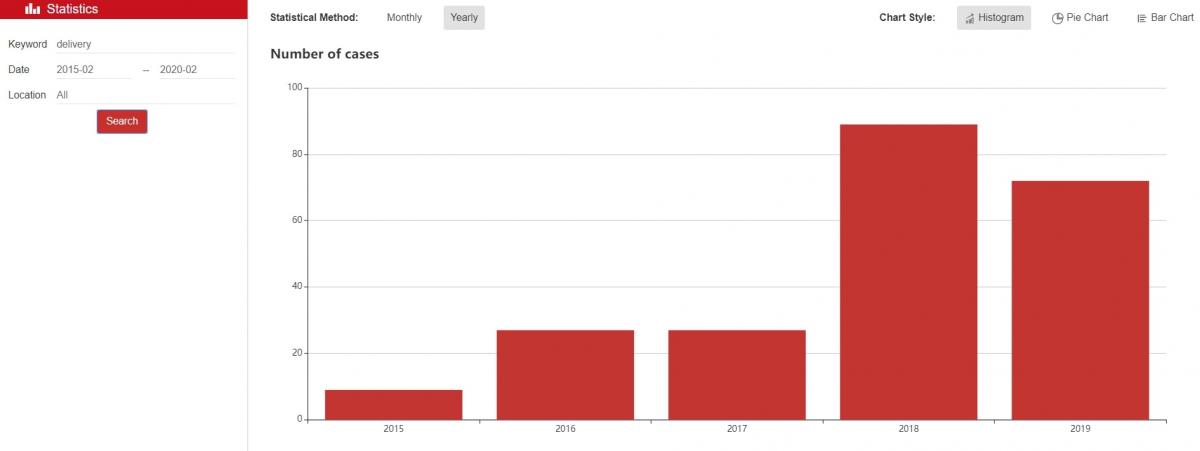
Users can also view the data in graphic/statistical form, rather than on the map interface. Just click on Graphs in the lower left-hand corner of the map. This will display a histogram with the number of incidents in each year or each month. As with the map, users can fine tune the graph to display collective actions in specific sectors, geographies, or month ranges.
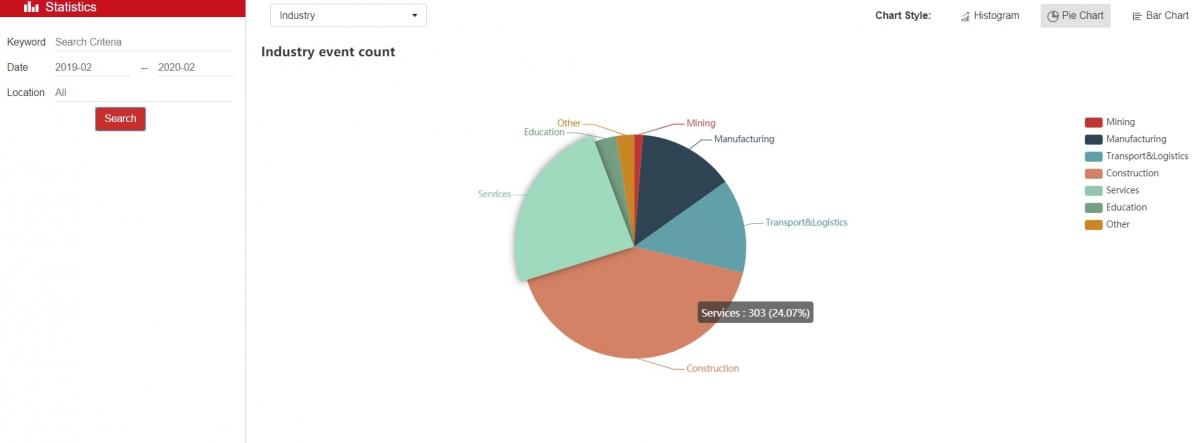
The pie chart function allows users to compare data based on different criteria such as industry, employee demands and company ownership type. Hover the cursor over the chart to display the actual number and percentage of incidents in each category.
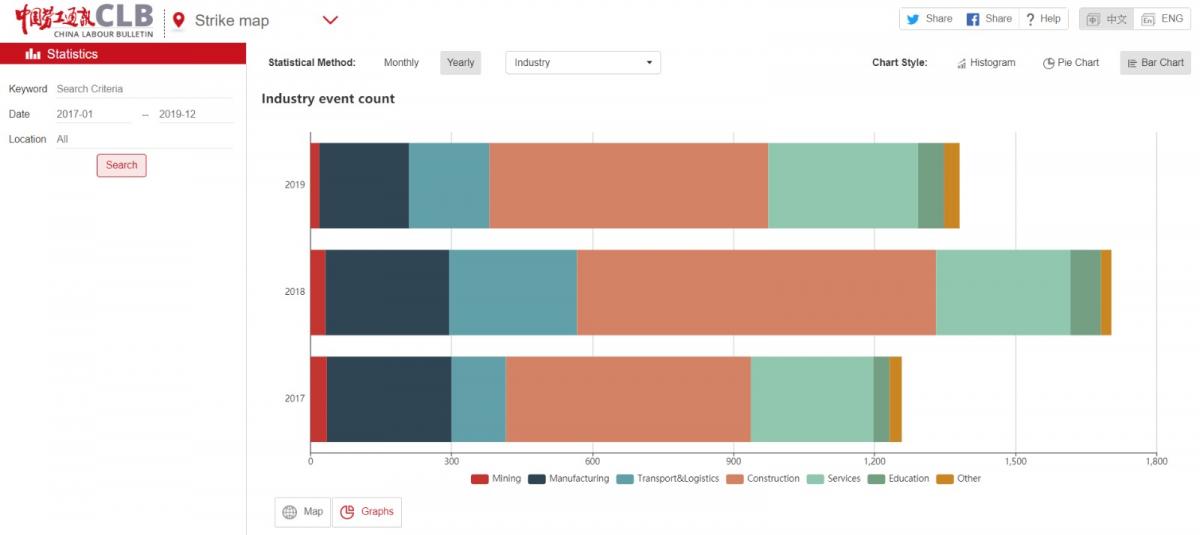
The bar chart combines the histogram and pie chart functions so that the data for each year or month over a defined time period can be broken down into specific industries, etc.*
* The Strike Map is not a definitive record of all the strikes and collective actions in China. We can only record those incidents that are in the public domain, usually posted on social media and occasionally in the official media. We estimate that - based on the occasional and partial statistics issued by the national and local governments in China - the Strike Map currently accounts for about five to ten percent of all incidents of worker collective action in China. However, that sampling rate varies randomly, so we would caution against comparing incident totals over an extended period of time.
Notes for researchers on map categories
We are often asked how exactly we categorise the incidents included on the Strike Map. Some key points to bear in mind are as follows:
Company ownership
Businesses classified as “state owned enterprises” are companies managed by the State-owned Assets Supervision and Administration Commission (SASAC) of the State Council or local governments. “Public institutions” such as public schools, public hospitals and government agencies are classified separately. If you wish to search for worker actions in the state sector as a whole, you can check both boxes at the same time. Note that most private companies listed overseas are classified as “joint venture.”
Action type
Workers often combine several different protest methods during a particular labour dispute. As such, one incident may have more than one type of action checked on the map.
The key difference between a “strike” and a “protest/demonstration” in our classification is that, in a strike, employees collectively withdraw their labour in a bid to stop the normal production of a company. Usually, workers will organise on social media and choose specific dates for strike action in order to put pressure on the employer. As a result, we can often see clear demands and the reasons for their actions in workers' online posts, which help us determine the nature of the action. Apart from factory workers, we most often see strikes by workers in the transport sector; taxi drivers, bus drivers, food delivery drivers, etc.
“Protest/demonstration” are those actions not specifically designed to halt production and might include, for example, demonstrations outside government offices by laid-off workers. Actions by construction workers seeking wage arrears after a construction project has been completed often falls into this category.
Responses to collective action
“Police” indicates that police officers were called to the scene of a protest to mediate in the conflict or monitor the situation, not necessarily to make arrests.
“Negotiations with management” is checked when worker representatives engage in bargaining with company owners and when workers have more informal discussions with management during a protest.
“Government intervention” typically involves officials from the local labour department, local courts or other local and administrative agencies intervening after the workers have appealed to the government for help.
“Union intervention” means that local trade union officials mediated in the labour dispute.
“Trade union accountability” refers to CLB’s trade union reform and accountability program (工会改革观察与促进) in which we discuss specific incidents with relevant trade union officials to ascertain the extent of their involvement in the case and their response to the workers’ demands. Separately, all the trade union accountability cases have been logged in a map dedicated to this project and housed on our Chinese-language website.