In the first half of 2017, Chinese worker collective actions recorded by CLB’s Strike Map confirm that trends observed since 2016 are consistent with the new economic normal.
Collective worker actions in retail and services, at almost 22% of the total number of incidents recorded, are consistently on par if not exceeding those in the traditional export-oriented manufacturing sector, which stood at 21% in the first six months of 2017, a trend first registered in the third quarter of 2016.
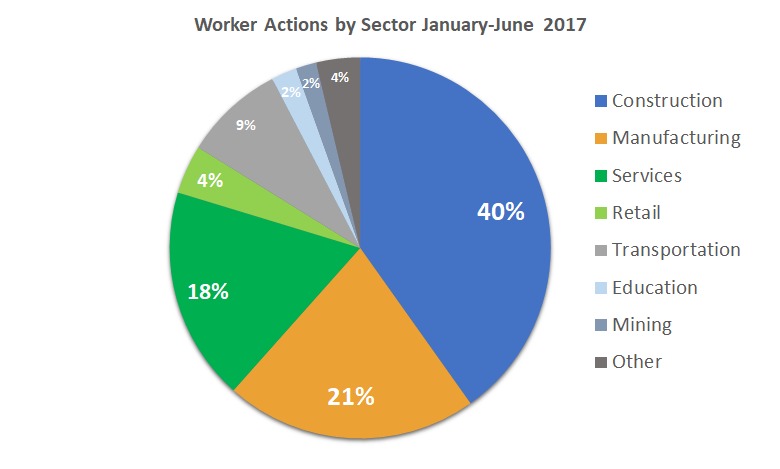
In the first half of 2017 protests and strikes in the services and retail sectors continue to maintain a level at or above that of manufacturing. Meanwhile, construction continues to be the single sector with the highest number of recorded incidents according to the CLB Strike Map.
With the government’s emphasis on domestic consumption, labour unrest has simultaneously shifted from the factory floor to consumption-oriented economic sectors like catering and transportation, highlighted by dramatic examples like the consecutive violent clashes between Meituan food delivery drivers and security forces in July.
A closer look into the service and retail industry reveals that food services, including restaurants and bars, was the most volatile sector with 19.3% of total worker actions; couriers and logistics, which includes booming e-commerce delivery services including Meituan, is another flashpoint with an 11% share of actions in this sector. Also, with the explosive growth of bike sharing apps, worker protests in the industry have the potential to grow beyond the 5% share of the total within services registered in the first half of 2017.
Consistent with 2016 patterns, worker protests in manufacturing sector remained at around 21% of the total, with Shandong and Guangdong provinces registering the highest number of cases (16 and 14 cases respectively), but with a nuance: worker unrest in the northern province of Shandong was centered around heavy industries with SOE ties, while protests in Guangdong were mostly in private and foreign-owned companies. Jiangsu province, around the Yangtze River delta manufacturing hub, followed in the third place with 12 cases registered by the Strike Map; a third involved relocations or closures.
Guangdong province, China’s manufacturing powerhouse, remained at the top of the national list with a 13.6% share of the total number of collective actions, double the number of incidents registered in Henan (7.5%) and Jiangsu (7.35%), the second and third highest provinces respectively. Guangdong’s current labour unrest leveled up in the last two years after the 27% historic all-time peak in 2014, when a wave of factory closures and relocations hit the province.
Construction, with close to 40% of the total share in worker protests, is still the industrial sector with highest level of unrest in China. A surge of at least four times the average level was registered in January, right before the Chinese New Year holidays when migrant workers travel hundreds of kilometers to return to their families. Each year they fear leaving construction sites for home and never receiving their hard earned wages.
Unpaid wages remained the leading demand across all sectors, totalling a staggering 66% of a list of demands that ranges from unpaid social insurance (6.3%), factory relocation or closure (5.1%), pay increase (3.8%) and unpaid pensions (3.1%). This list is a reflection of the poor enforcement of China’s own labour laws, and how workers are still struggling for their most basic legal rights, like the lack of a labour contract.

A staggering majority of worker collective actions was again focused on demanding payment of wage arrears, a reflection of the poor enforcement of relevant legislation in China, where most migrant workers still go by without a formal labour contract. The Labour Contract Law was implemented a decade ago.
Between January and June 2017, CLB’s Strike Map recorded 465 collective worker actions.
Since the beginning of this year, CLB harvests data from a variety of open sources at a sampling rate of twice a week, which can yield a lower total number of incidents compared to recent years. In the absence of government statistics since 2010, CLB Strike Map statistics have always been an indicator of trends in worker actions in China. Strike Map data should not be interpreted as a tally of the total number of strikes and worker protests occurring in China, far from it, it’s quite likely only a small tip of the iceberg.